National Assessment of Educational Progress (NAEP)
This is a snapshot of 8th grade success based on the nationally accepted test NAEP (National Assessment of Educational Progress), separated into ethnicity. I want to explain that the words “Whites” “Blacks” “Hispanics” are the terms used by NAEP.
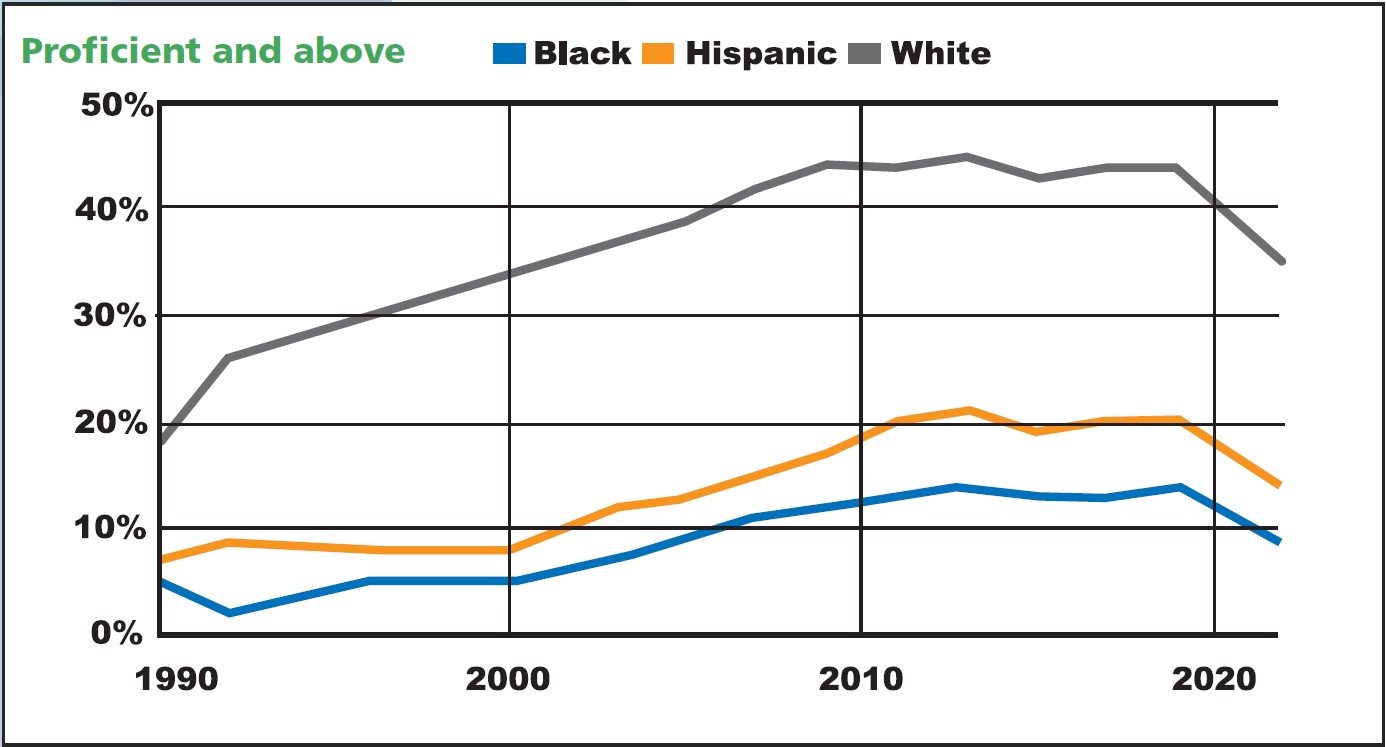
Graph of Proficient and above: These students are performing at grade level. You can see that Whites far out-perform Blacks and Hispanics and have the 30+ years of this test. You can see that even for Whites, we have never had more than 50% of these kids performing at grade.

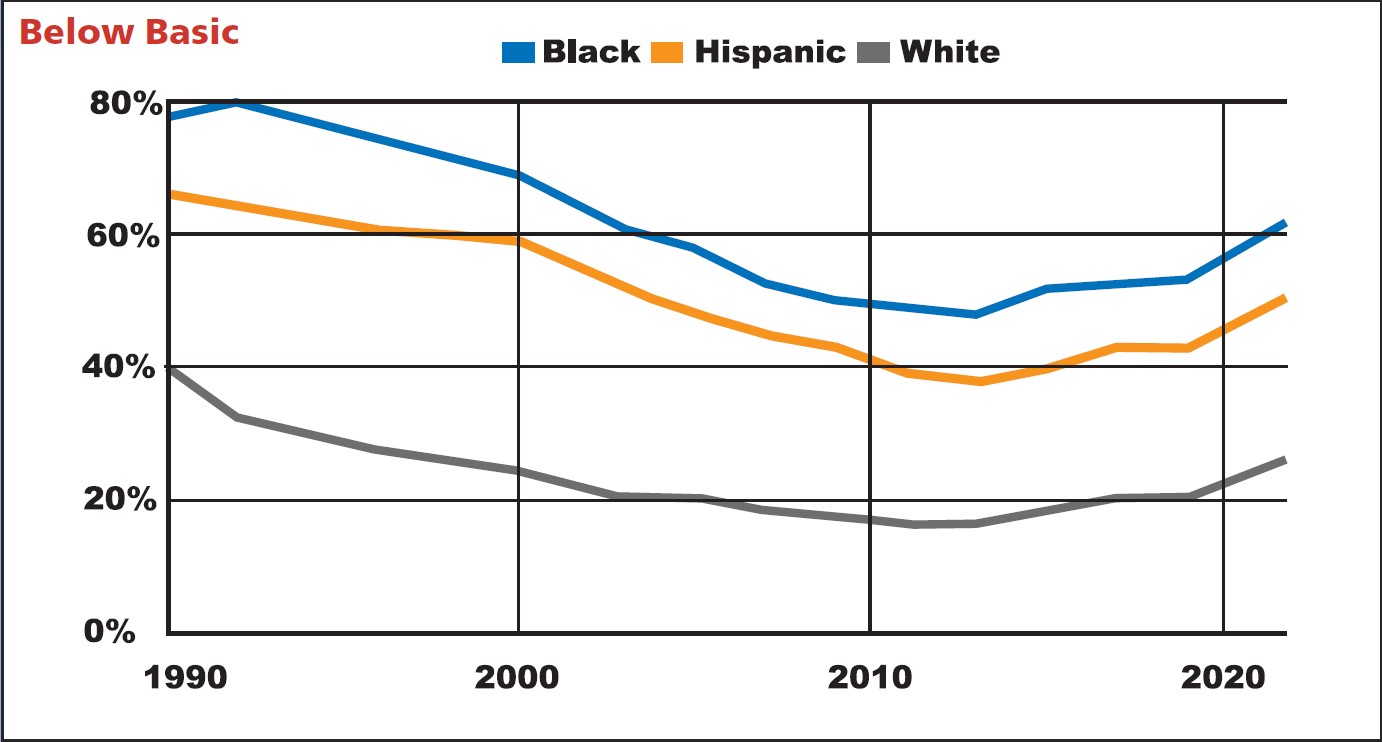
This is a very low bar. These are the kids who get nothing right to getting very little correct. The graph shows that 60 plus percent of Blacks perform below basic and 50% of Hispanics perform at the same low level as it has been for thirty years.


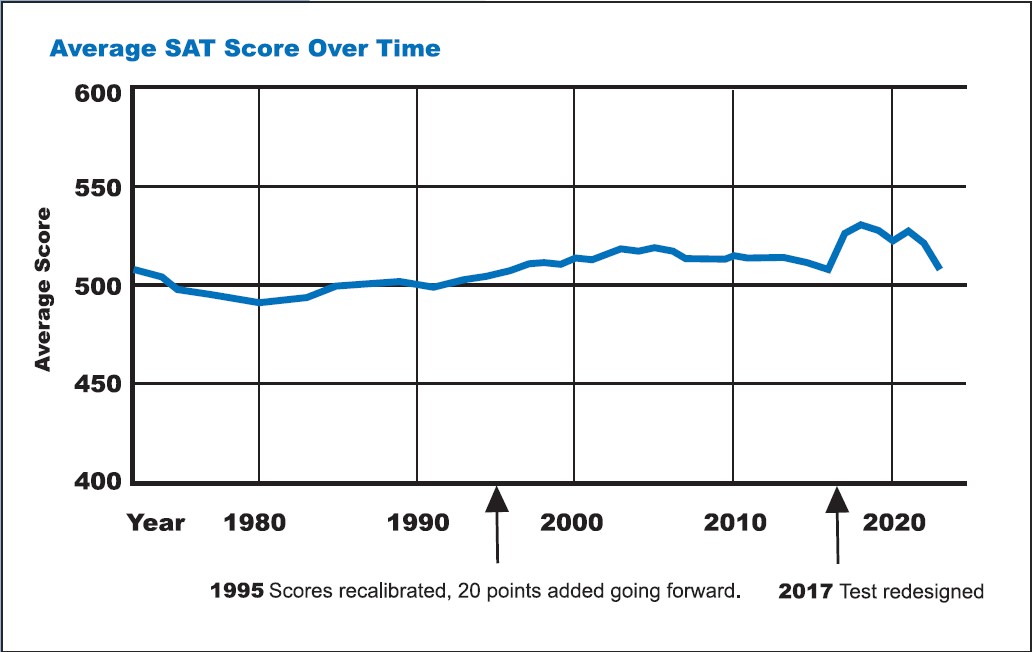
SAT scores show the same stagnation. These scores go back 50 years.
To summarize: Why have only 15% of African American students been at grade level or above in over 30 years? and for Latino students, only 29% have achieved grade level? And not even half of White students have performed at grade level in over 30 years? Translating into number of students, this is over 2 million 8th graders struggling in math.
